Whilst building out some new Grafana dashboards over the weekend I made the switch from InfluxDB to Promtheus node exporters for scraping metrics from Linux servers.
But how does one marry up the drivetemp-scsi-0-10 value output from sensors to a physical disk?
coretemp-isa-0000
Adapter: ISA adapter
Package id 0:  +43.0°C  (high = +82.0°C, crit = +100.0°C)
Core 0:        +33.0°C  (high = +82.0°C, crit = +100.0°C)
Core 1:        +33.0°C  (high = +82.0°C, crit = +100.0°C)
Core 2:        +38.0°C  (high = +82.0°C, crit = +100.0°C)
Core 3:        +43.0°C  (high = +82.0°C, crit = +100.0°C)
Core 4:        +33.0°C  (high = +82.0°C, crit = +100.0°C)
Core 5:        +34.0°C  (high = +82.0°C, crit = +100.0°C)

drivetemp-scsi-0-50
Adapter: SCSI adapter
temp1:        +31.0°C  (low  =  +0.0°C, high = +65.0°C)
                       (crit low = -40.0°C, crit = +70.0°C)
                       (lowest = +30.0°C, highest = +34.0°C)

drivetemp-scsi-5-0
Adapter: SCSI adapter
temp1:        +26.0°C  (low  =  +0.0°C, high = +65.0°C)
                       (crit low = -40.0°C, crit = +70.0°C)
                       (lowest = +25.0°C, highest = +30.0°C)

drivetemp-scsi-0-30
Adapter: SCSI adapter
temp1:        +29.0°C  (low  =  +0.0°C, high = +65.0°C)
                       (crit low = -40.0°C, crit = +70.0°C)
                       (lowest = +28.0°C, highest = +33.0°C)
By using lsblk, we can strip the drive serial number and scsi (HCTL) value like so:
root@morpheus:~# lsblk --noheadings --output=SERIAL,HCTL --scsi
3HG7TJ8N        0:0:0:0
Y6GX1KWC        0:0:1:0
5PK9EAHE        0:0:2:0
5PGENVSD        0:0:3:0
Y6GE3JJC        0:0:4:0
5PJJ0K4F        0:0:5:0
Z2GJ4V4T        0:0:6:0
ZJV5CF96        0:0:7:0
S6PTNZ0T331139A 1:0:0:0
S6PTNM0TA60489X 2:0:0:0
9LJSSYVG        5:0:0:0
9LJ8JJ8G        6:0:0:0
Using this output we can see that 0:0:3:0 maps to drivetemp-scsi-0-30 and so on.
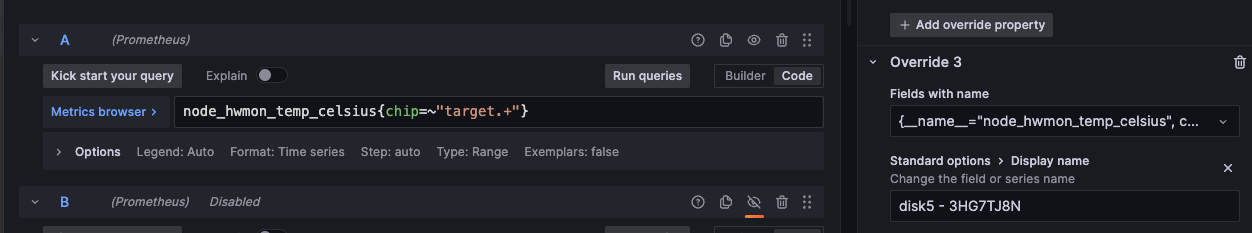
Then, on the grafana side of things we can use overrides to map the specific value from node_hwmon_temp_celcius to the physical drive name we’re looking for.
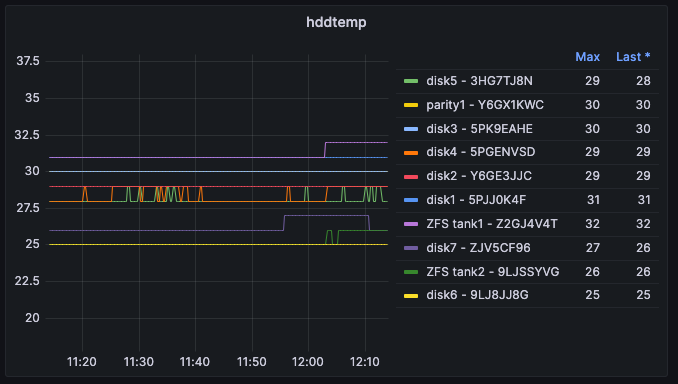
The final product ended up looking like this for my dashboard.
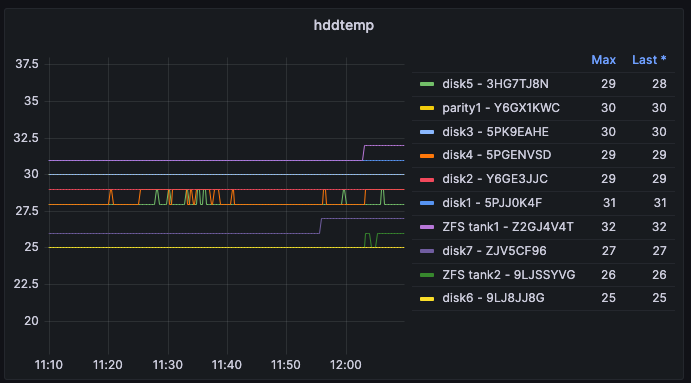
There we are, a quick and easy way of mapping scsi drive temps using Prometheus’ node_exporter into a more user friendly output.